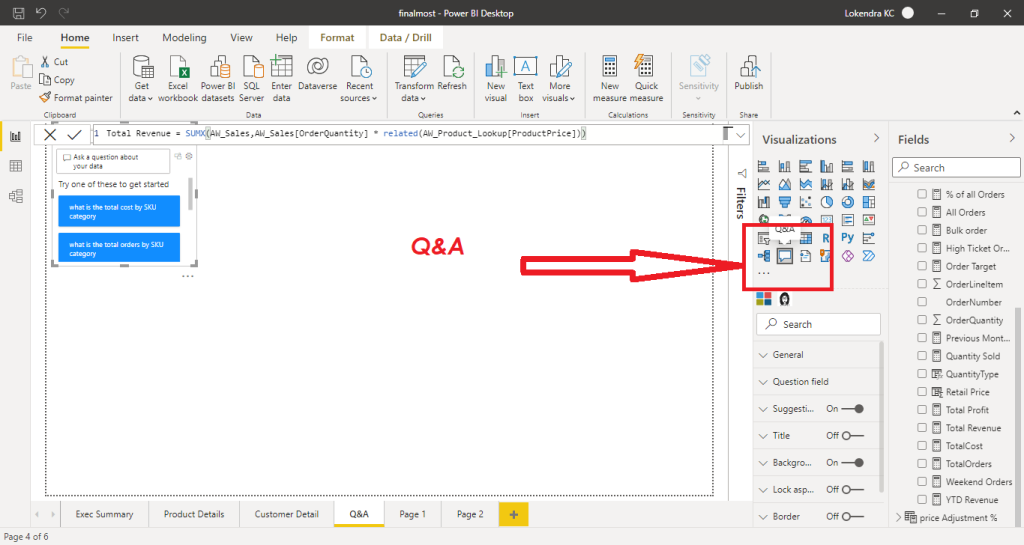
QA section is the artificial intelligence category of data visualization in power BI , You can find the many questions related to your data; additionally you can write standard question and the power BI visualize according to your question. This is one of the amazing feature I recently found.
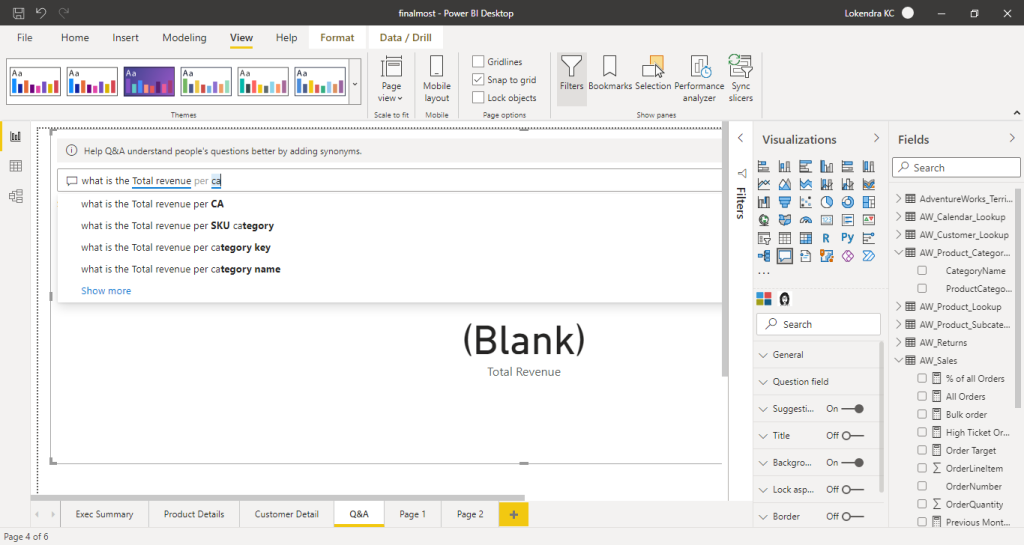
As in the above figure as you write the question , Power BI automatically suggest some other questions, here in this special case I want to calculated the total revenue per category name.
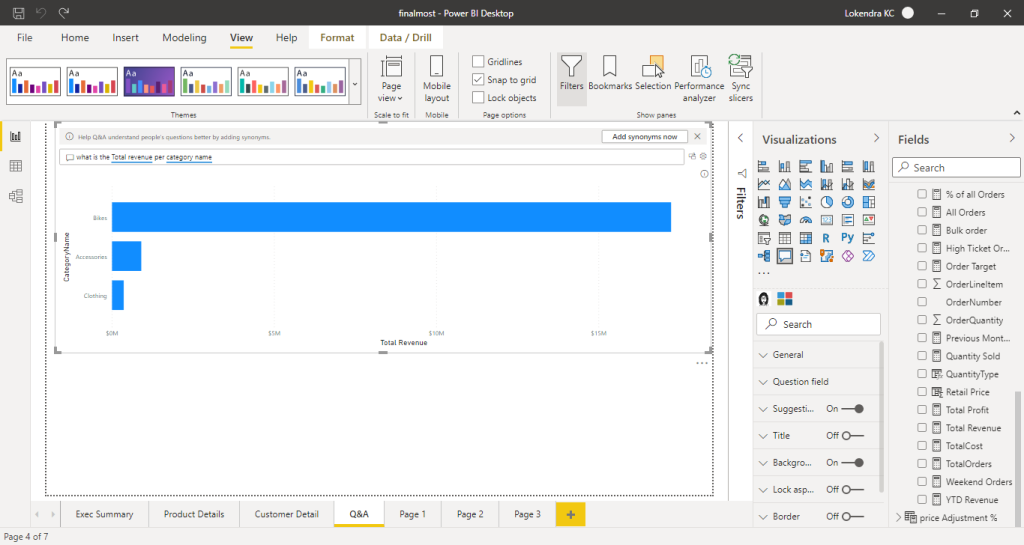
In above figure Power BI automatically insert the bar graph showing total revenue by category name, which we can format according to our needs later.
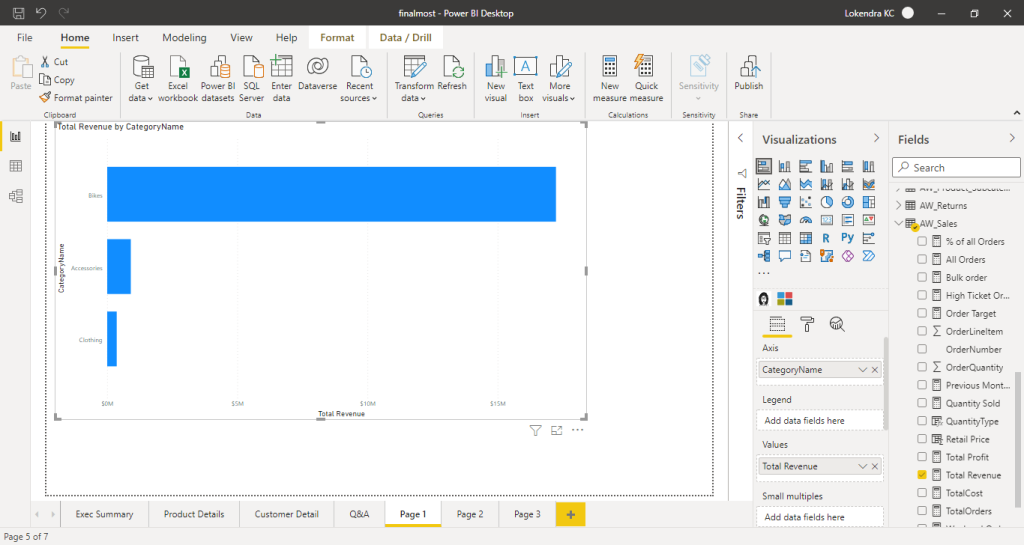
In this figure we compare the previous Q&A visual by another manually inserted bar graph which shows that the visualization is accurate.
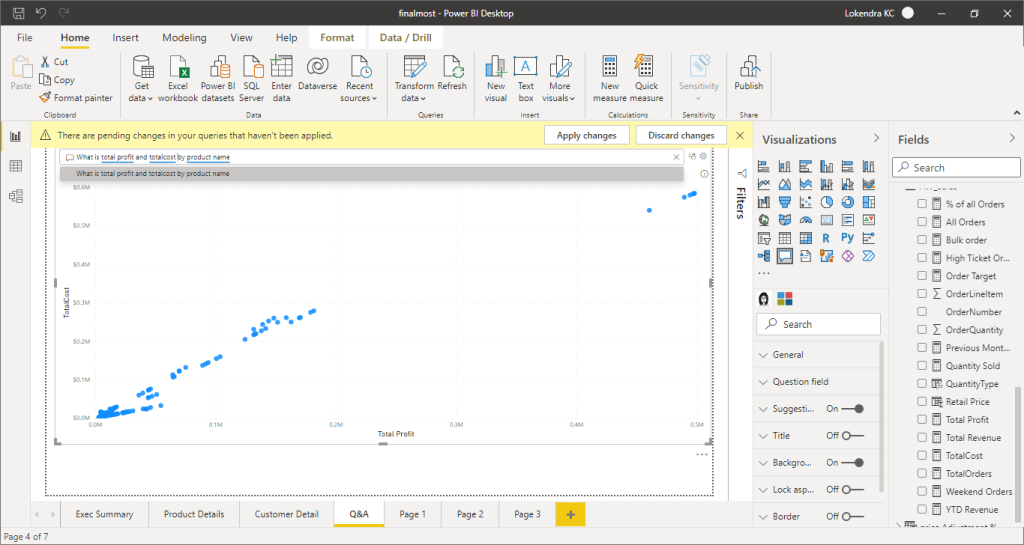
The power BI is capable of handling AI powered complex question like total profit and total cost by product name.